
Web3 & Mapping 3.0: Locate, Navigate, Understand
Author:

Bryce Bladon
Published on
November 14, 2025
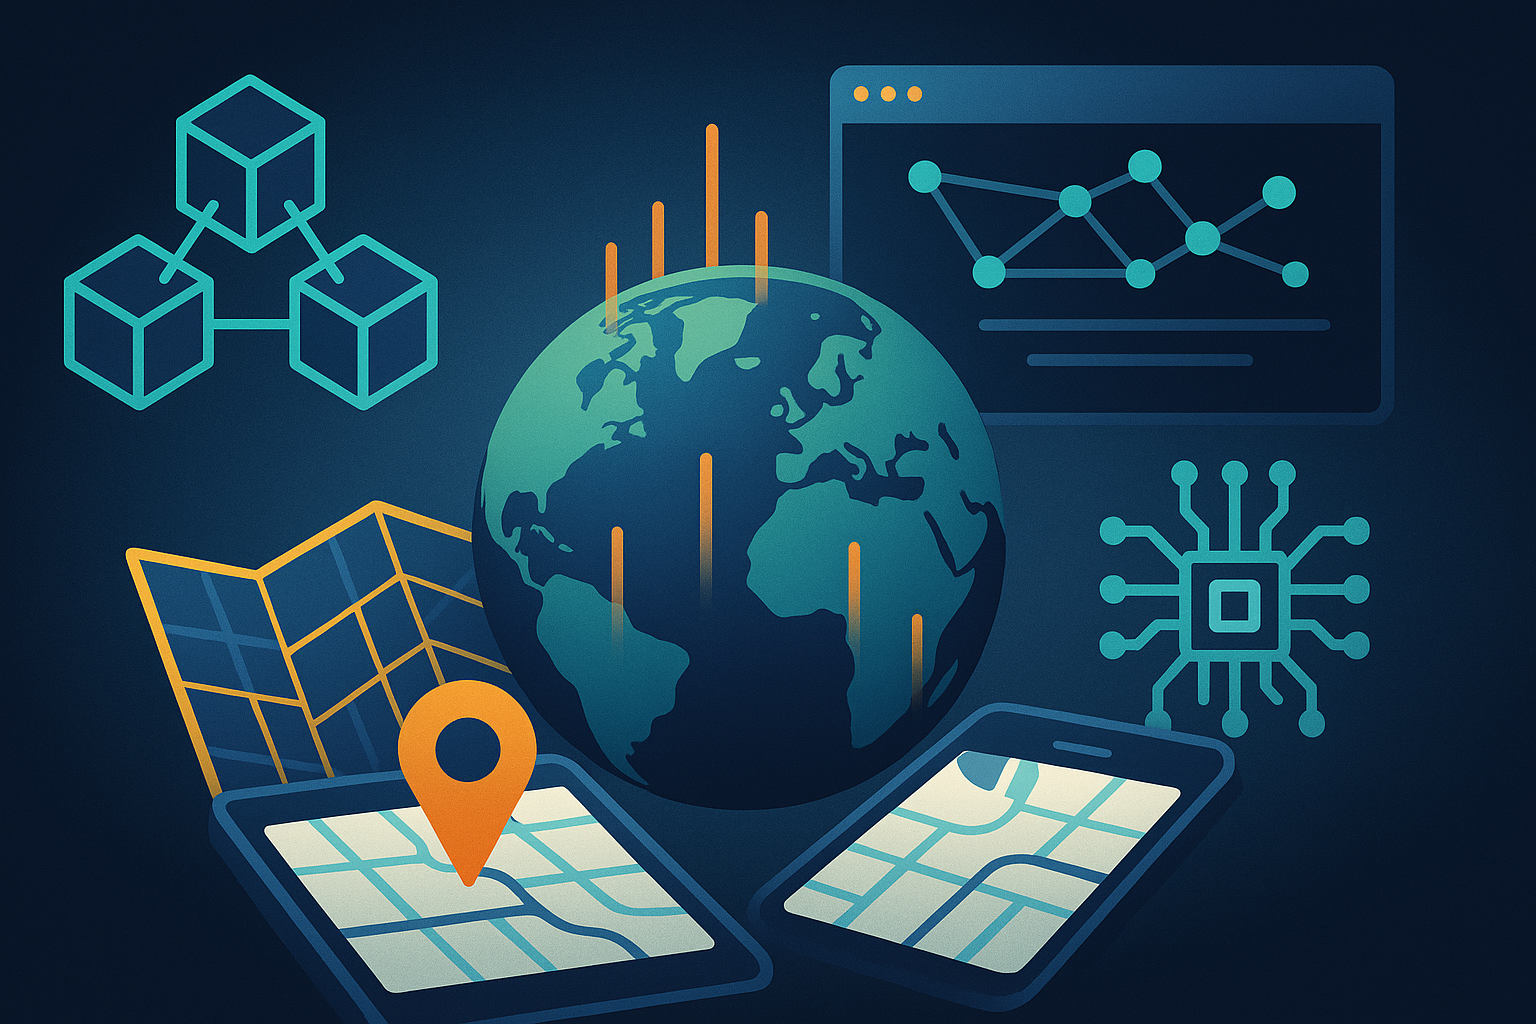
When you open a modern map via an app, you're not just seeing where things are—you're seeing what they mean, where they'll be, and what will happen next. Welcome to Mapping 3.0: the latest evolution in mapping.
Both the web and mapping technology have evolved through three distinct phases, each building upon the last.
Below is the web’s evolution from web1 to now.
Web1 (1990s-early 2000s): The Read-Only Web
Web2 (2000s-present): The Read-Write Web
Web3 (proposed): The Read-Write-Own Web
Web1 let you read, Web2 let you read and write, and Web3 promises to let you read, write, and own.
Similarly, Mapping 1.0 let you locate, Mapping 2.0 let you navigate, and Mapping 3.0 lets you understand.
Below is mapping’s evolution from mapping 1.0 to now.
Mapping 1.0: "Locate" (~3000 BCE - 1990s)
Mapping 1.0 established where things are through fixed coordinates
Timeline: Starts around ~3000 BCE with the first known maps (Babylonian clay tablets) and extends until GPS becomes fully operational for civilian use in 1995.
Defined by: Fixed coordinate systems of latitude and longitude (x and y)
Key Characteristics:
For example: In 1804, Lewis and Clark used compass surveys and celestial observations to map the American West. Their expedition took three years to chart what a GPS device now locates instantly. The maps they created answered one fundamental question: "Where is this river, this mountain, this territory?" Their work enabled westward expansion by establishing fixed coordinates that others could reference for decades.
Mapping 2.0: "Navigate" (~1990s - 2010s)
Mapping 2.0 established what is at a location, and how to navigate it through interactive wayfinding
Timeline: Starts around 1996 when MapQuest launches the first online mapping service, and evolves through Google's Waze acquisition in 2013, which demonstrated the value of crowdsourced traffic data.
Defined by: Dynamic, real-time updates that augment static representations (x, y, and z)
Key Characteristics:
Real-World Example: In 2005, Hurricane Katrina devastated New Orleans. Google Maps had launched just months before, and volunteers used it to mark shelter locations, road closures, and rescue needs in real-time. First responders could finally answer not just "Where is the Superdome?" but "How do I get there from here given current road conditions?" This was impossible with paper maps. The platform turned maps from reference documents into navigation tools that adapted to changing conditions.
Mapping 3.0: "Understand" (~2010s - Present)
Mapping 3.0 established what will be. It provides context for decision-making through predictive and semantically-rich intelligence.
Timeline: Starts around 2010 when Google begins using machine learning for traffic prediction, and continues today as Apple Maps adds 3D city experiences, Uber implements surge pricing, and real-time wildfire and climate impact mapping becomes standard.
Defined by: Predictive and contextually-rich intelligence that evolves alongside interactive applications or temporal changes (x, y, z, and time)
Key Characteristics:
Real-World Example: In 2020, California's wildfire season reached unprecedented severity. Mapping platforms began integrating real-time satellite data, air quality sensors, wind patterns, historical burn data, and predictive models. Residents could now see not just "Where is the fire?" (Mapping 1.0) or "How do I evacuate?" (Mapping 2.0), but "Based on wind patterns and fuel conditions, where will the fire likely spread in the next 6-12 hours, and when should I leave to avoid congestion?" Insurance companies used the same temporal data to predict property risk. Emergency services optimized resource deployment. This shift from reactive to predictive mapping saved lives by helping people understand their situation before a crisis struck.
Each era of mapping adds a new dimension and a new verb.
The evolution mirrors broader technological trends: from information storage, to information access, to information intelligence. Just as the internet progressed from read-only to read-write to read-write-own, maps have progressed from locate to navigate to understand.
While most people think of maps as navigation tools, Mapping 3.0 represents a fundamental shift from showing location to providing insight. Here's what defines this era:
Temporal Intelligence
Maps now show change over time, not just current state. Google Earth Timelapse visualizes decades of environmental transformation, revealing patterns invisible in static snapshots. Urban planners can watch cities expand, researchers can track deforestation, and climate scientists can document glacial retreat—all by comparing the same coordinates across years.
Predictive Capabilities
Modern mapping anticipates what will happen. Uber's surge pricing maps predict demand patterns before they occur, allowing the platform to position drivers where riders will be, not where they are now. Climate risk mapping forecasts flood zones and fire risks decades into the future, helping communities prepare for challenges that haven't yet materialized. Agricultural mapping predicts crop yields based on weather patterns, soil conditions, and historical data, allowing farmers to make planting decisions months before harvest.
Contextual Understanding
Mapping 3.0 interprets what locations mean, not just where they are. A commercial real estate platform doesn't just show an empty lot—it layers in zoning regulations, demographic trends, foot traffic patterns, nearby development plans, and comparable property values to help investors understand the opportunity. A public health map doesn't just mark disease outbreaks—it correlates them with sanitation infrastructure, population density, climate data, and mobility patterns to identify root causes and predict spread.
Machine Learning Integration
Since 2010, when Google began using machine learning for traffic prediction, AI has become central to extracting patterns and generating insights from spatial data. These systems identify correlations humans would miss: that a particular intersection becomes congested 15 minutes after a train arrives, that certain neighborhoods see delivery demand spike during specific weather conditions, or that infrastructure failures follow predictable spatial and temporal patterns.
We may already be approaching the end of Mapping 3.0. Here’s why:
This suggests that a new paradigm might be emerging. Perhaps Mapping 3.0's "Understanding" will evolve into fully predictive environments that can model complex scenarios and outcomes—moving from "what will happen" to "what would happen if..."
As mapping becomes more predictive and contextually intelligent, it increasingly relies on high-resolution, frequently-updated spatial data. Traditional data collection methods—satellite imagery updated quarterly, surveying teams deployed annually, government datasets years out of date—cannot support the temporal and predictive intelligence that Mapping 3.0 requires.
The future of mapping depends on automated, distributed, and continuous data collection networks. Just as Web3 envisions decentralized infrastructure for the internet, the next generation of spatial intelligence requires decentralized infrastructure for the physical world.
For those of us working with spatial data, we're not just capturing coordinates anymore. We're building the intelligent infrastructure that will power how humanity understands, predicts, and responds to our changing world.

USDC rewards are now live on the LayerDrone Network.
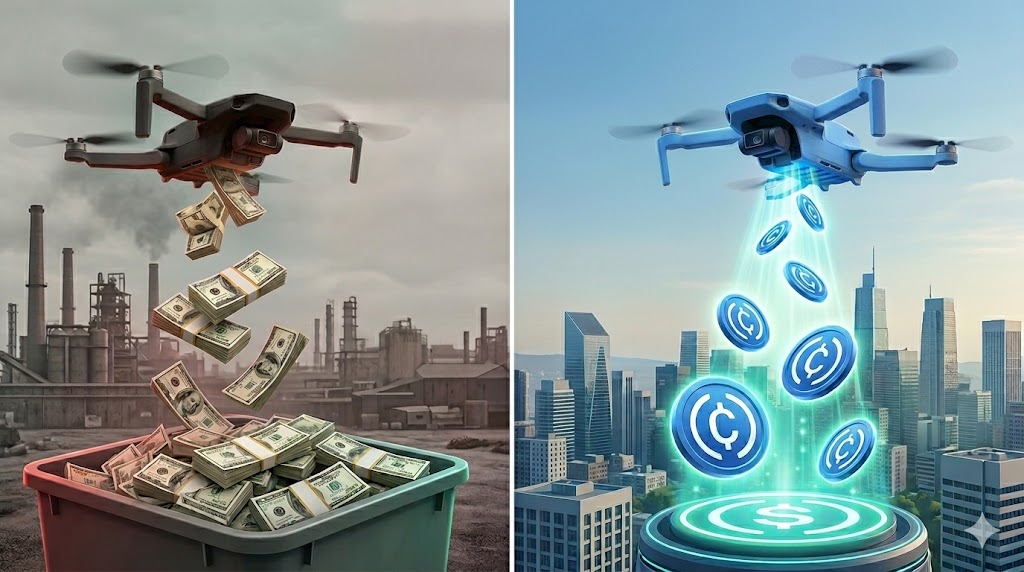
From March 14th to March 16th, new missions and mission reservations will be paused to prepare for USDC rewards.